Dashboards that translate maturity into decisions
SUSA connects day-to-day scoring to charts and summaries your stakeholders can act on—without losing the CSF thread back to detailed work.
In the product
Dashboards and charting read from the same structured scores you capture in assessments.
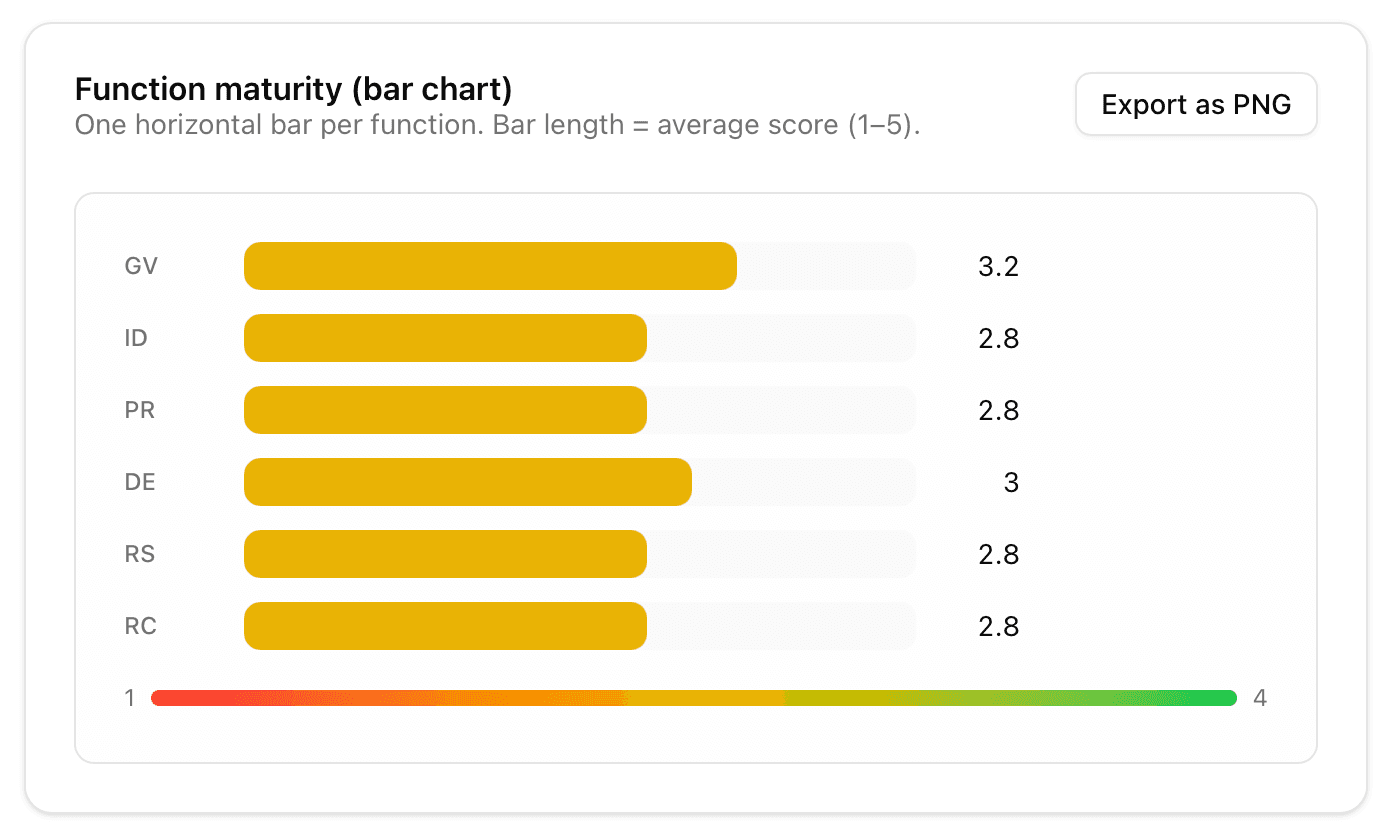
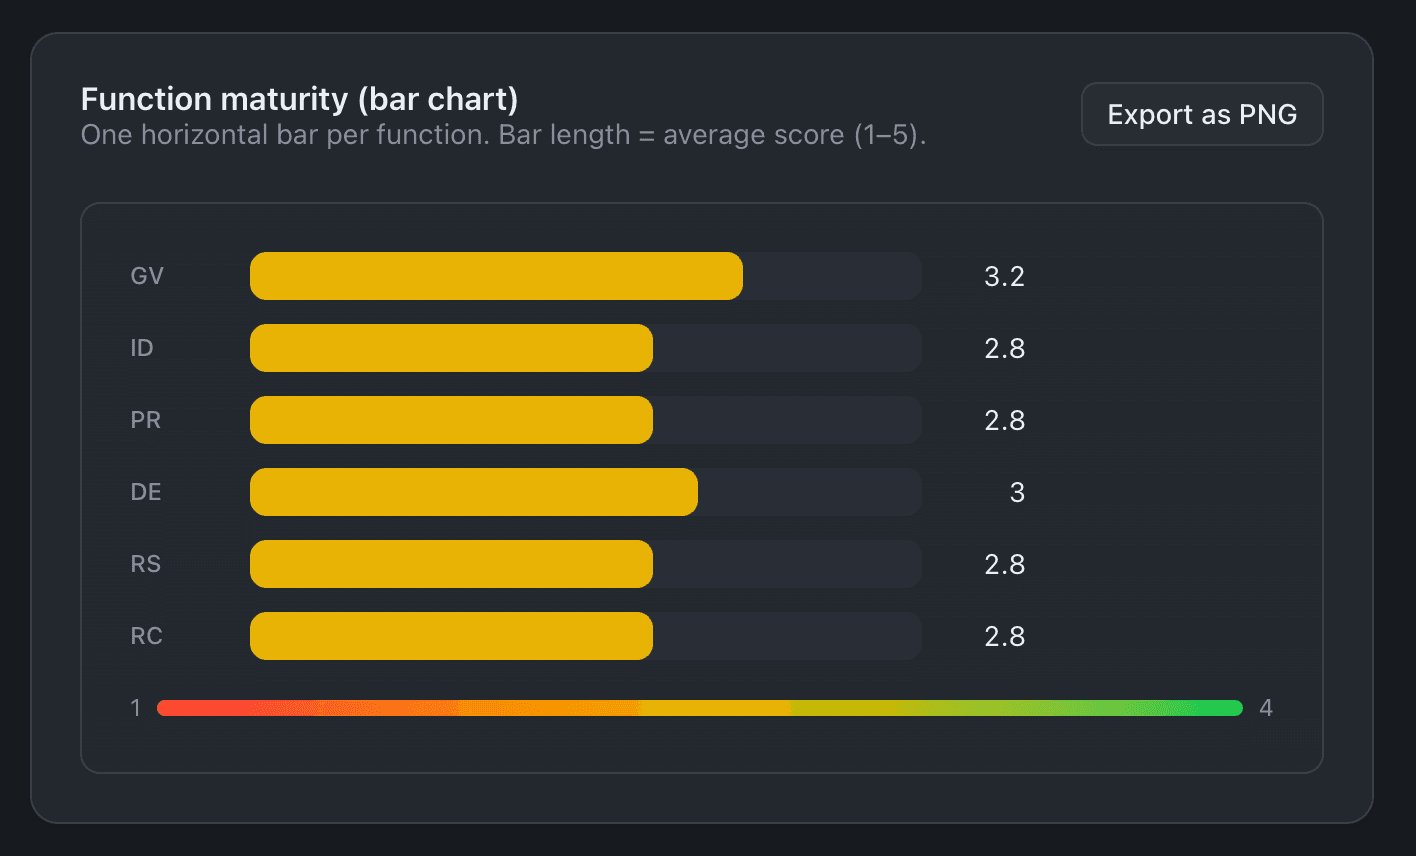
Reporting built on the same data model
Because charts read from structured CSF scores—not pasted ranges—your dashboard stays honest when assessments update.
Leadership line of sight
Roll up subcategory work into views that answer “where are we?” and “what moved?” without rebuilding slides from raw spreadsheets.
Trend and comparison
Track movement over time and contrast current versus target posture so investment discussions stay grounded in the same framework as assessments.
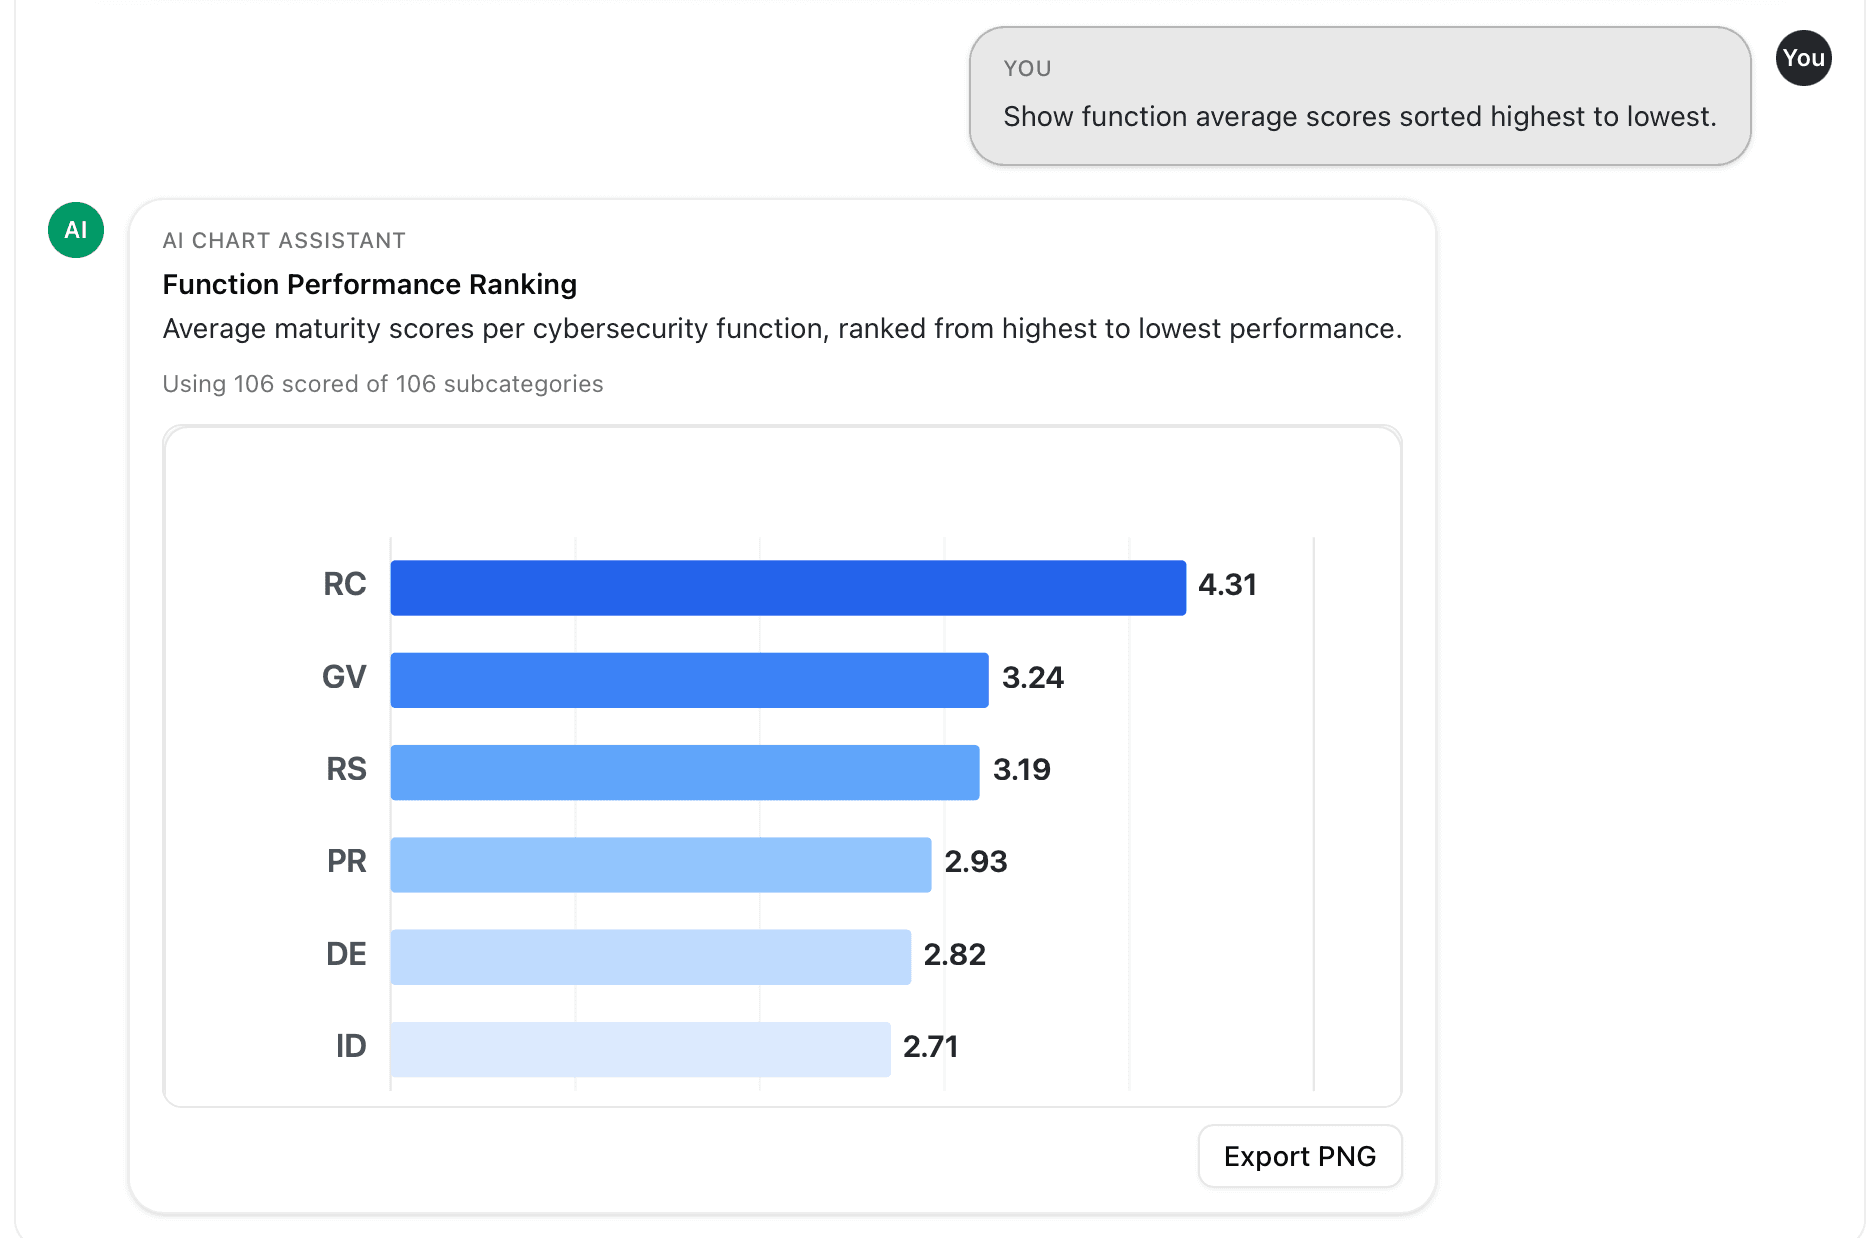
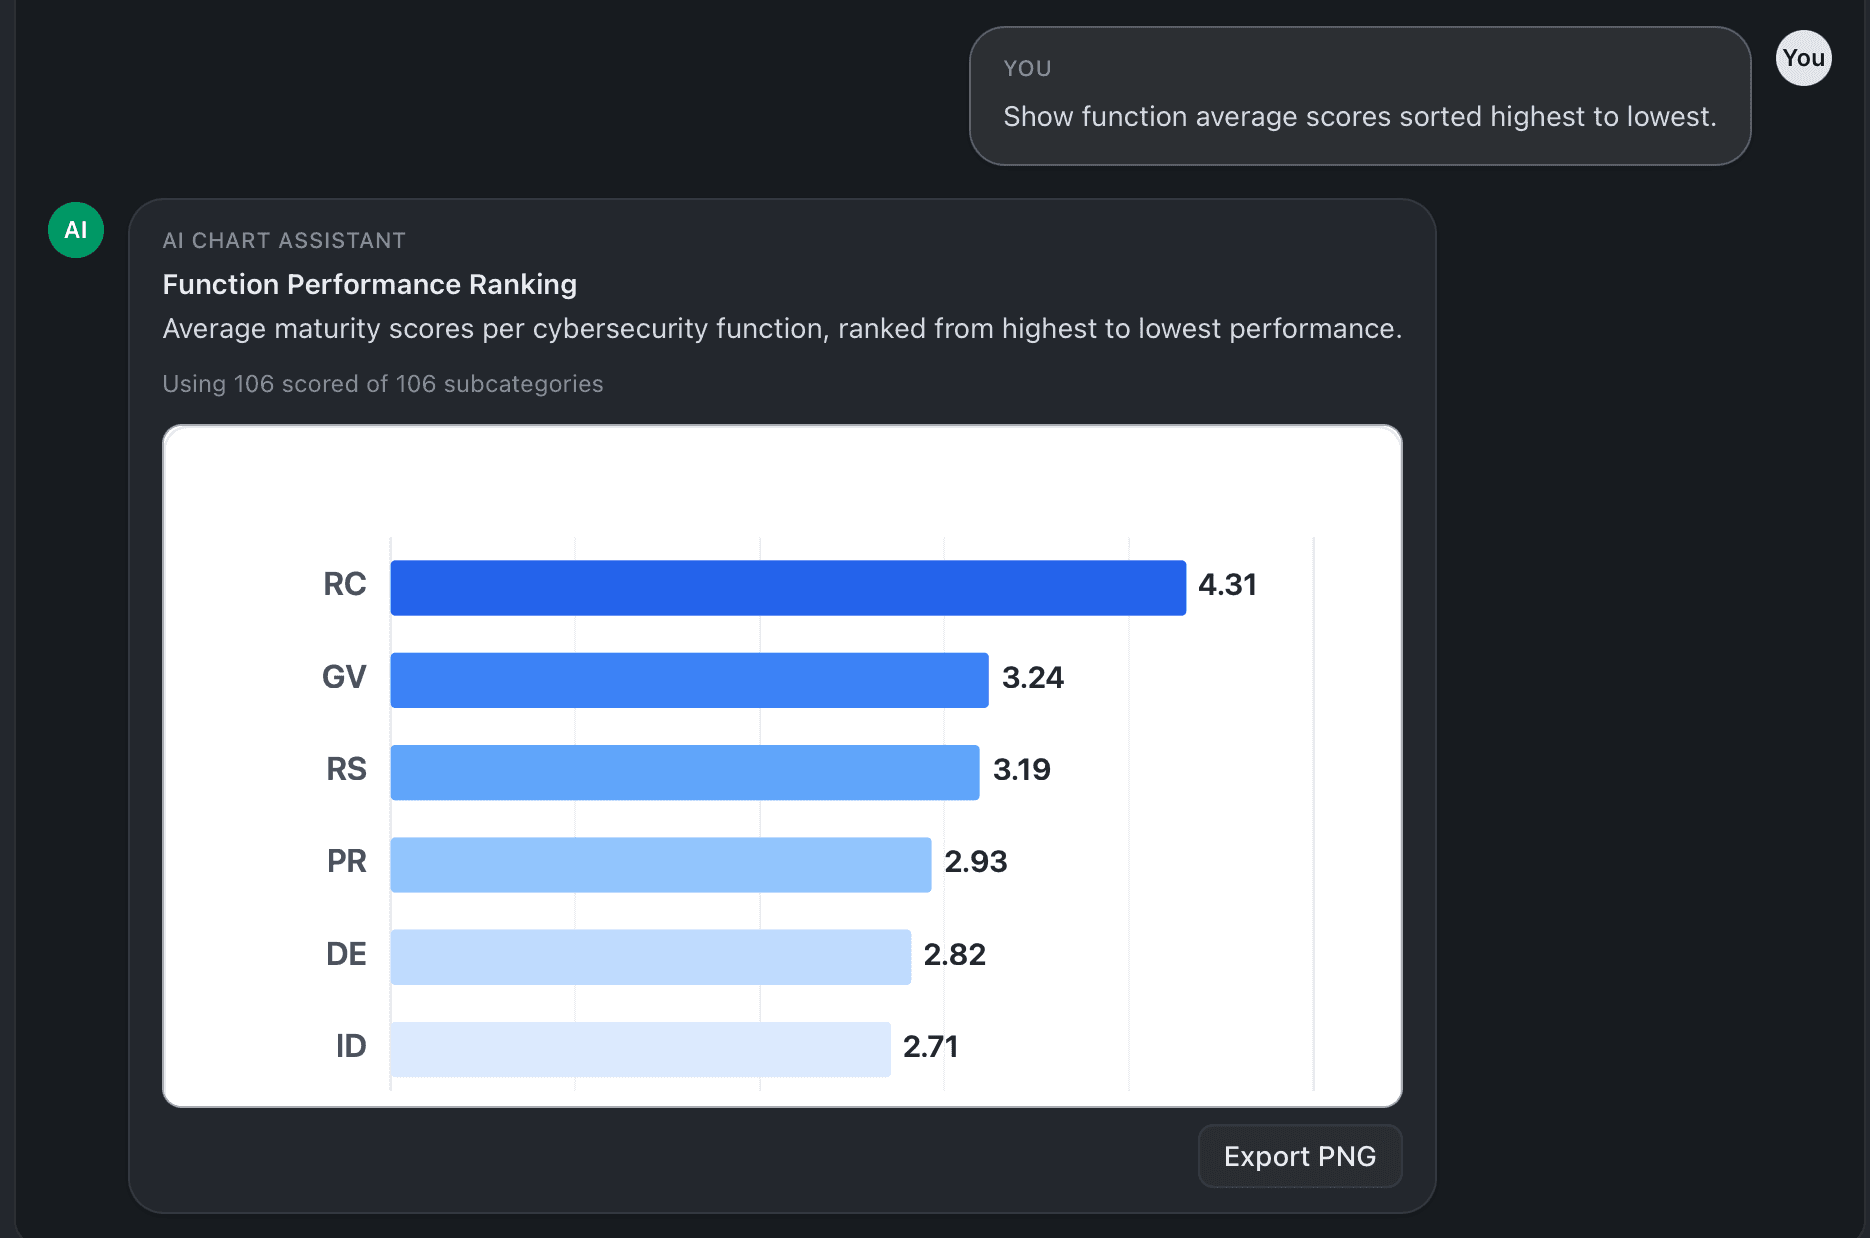
Function-level storytelling
Organize the narrative by NIST functions when you brief boards, risk committees, or business partners who think in outcomes, not ticket volumes.
Who uses it
- CISOs and program owners briefing executives on posture and program velocity.
- Risk and GRC partners who need a consistent maturity vocabulary across quarters.
- Consultants aligning client deliverables to a living workspace instead of static exports.
See it in your workspace
SUSA brings NIST CSF structure, reporting, and collaboration into one place.